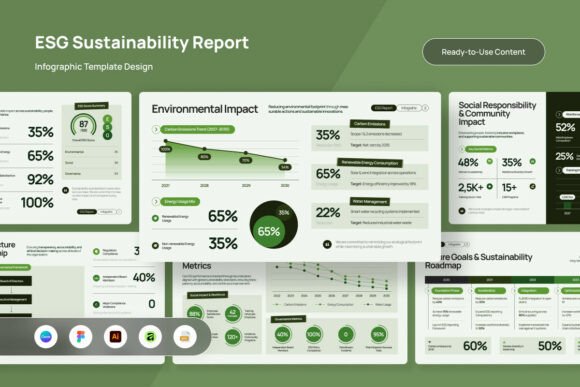
ESG Sustainability Report Infographic V2
Turning dense sustainability data into a compelling, credible story isn’t just about visualization—it’s about strategic clarity. The ESG Sustainability Report Infographic V2 is built for professionals who need to translate complex metrics—like Scope 1–3 emissions reductions, board diversity ratios, or supply chain audit scores—into presentations that resonate with executives, investors, and regulators alike.
Why ESG storytelling demands more than charts
Most sustainability reports drown in tables and pie charts. Stakeholders skim. Decision-makers delay. Credibility wavers when numbers feel disconnected from real-world action. The ESG Sustainability Report Infographic V2 addresses this by merging two essential elements: editorial precision and corporate-grade structure. It’s not decorative—it’s functional narrative design. Each layout uses a disciplined grid system to anchor KPIs, timelines, and comparative benchmarks without sacrificing visual rhythm. That balance lets your audience grasp progress at a glance while trusting the rigor behind it.
Real impact starts with editable foundations
This isn’t a static template. With 6 distinct infographic design variations, you’re not choosing a look—you’re selecting a communication strategy. One variation emphasizes year-over-year carbon intensity trends with layered timeline bars; another uses a radial governance scorecard to highlight policy alignment across regions. All files are fully layered and editable in Illustrator, Affinity, EPS, Figma, and Canva—so you’re never locked into someone else’s hierarchy or color logic.
Text, icons, color palettes, and even chart axes adjust seamlessly. Need to rebrand the entire set to match your firm’s Pantone palette? Done. Swap out a regional emissions bar for a water stewardship metric? No rework needed. That level of flexibility saves hours per report—especially when multiple stakeholders request last-minute revisions before an investor briefing or ESG audit review.
Who benefits—and how
Consulting firms use these infographics to elevate client deliverables without rebuilding visuals from scratch. Instead of spending days aligning fonts and recalculating percentages in PowerPoint, they drop in pre-validated layouts, update values, and focus on insight—not formatting. One climate advisory team reported cutting sustainability deck prep time by 40% while increasing stakeholder engagement during board reviews.
Sustainability leads at midsize enterprises find value in consistency. When ESG disclosures span annual reports, investor decks, and internal dashboards, the ESG Sustainability Report Infographic V2 ensures messaging stays unified—even as data sources shift. Its rigorous grid supports clean integration with live data exports (e.g., CSV-driven charts in Figma or Illustrator scripts), so updates propagate reliably across formats.
Marketing and comms teams leverage the editorial aesthetic to humanize technical content. A renewable energy startup used Variation 3—a split-layout showing emissions avoided vs. households powered—to convert a dry CSR summary into a social media carousel that increased LinkedIn engagement by 2.7×. The design didn’t oversimplify; it clarified cause and effect.
Design integrity meets practical constraints
The collection uses only free, open-source fonts and outputs in RGB at 72dpi—ideal for digital reporting, web publishing, and screen-based presentations. That means no licensing surprises, no font substitution errors, and fast load times. But it also means these files aren’t intended for high-res print brochures or large-format banners without upscaling adjustments. If your organization regularly produces glossy annual reports or trade show signage, consider testing export fidelity at scale—or supplementing with vector refinements.
Also worth noting: while all objects are editable, the underlying structure assumes basic familiarity with vector tools. Someone new to Illustrator may need 30–60 minutes to orient themselves with layer naming conventions and grouping logic. The included Readme file walks through font sourcing, file relationships, and common customization paths—making onboarding smoother than many multi-format design kits.
Beyond aesthetics: building trust through transparency
Trust in ESG reporting hinges on perceived honesty—not just accuracy. The ESG Sustainability Report Infographic V2 supports that by making methodology visible. For example, one variation includes subtle annotation zones beside each KPI—space to add brief context like “calculated per GHG Protocol Scope 3 Category 1” or “audited by SGS Q1 2024.” These aren’t footnotes buried in appendix text; they’re integrated, legible, and proportionally balanced within the visual field.
That approach matters when presenting to skeptical audiences—say, ESG analysts comparing your governance score against industry peers. A clean, labeled benchmark bar doesn’t hide complexity; it invites scrutiny. And because every element is editable, you can tailor those annotations to reflect your actual verification process—not a generic placeholder.
A tool that grows with your maturity
Early-stage sustainability programs often struggle with inconsistent data collection. The ESG Sustainability Report Infographic V2 helps bridge that gap—not by hiding gaps, but by framing them constructively. One variation includes optional “data maturity indicators”: visual cues (like fill-level circles) next to KPIs to signal whether metrics are estimated, modeled, or third-party verified. It’s honest, scalable, and signals continuous improvement—without requiring perfect data to begin communicating.
As your program evolves, the same file set supports deeper analysis. Add trend arrows, overlay regulatory deadlines, or embed QR codes linking to full methodology docs—all without breaking layout integrity. That adaptability makes it useful across phases: from first-time GRI reporting to SASB-aligned investor briefings.
Final thought: clarity is a competitive advantage
In a landscape where greenwashing erodes credibility daily, how you present sustainability data shapes perception as much as the data itself. The ESG Sustainability Report Infographic V2 doesn’t promise transformation—it delivers infrastructure for it. It gives you the scaffolding to communicate with authority, consistency, and nuance. Whether you’re preparing for a CDP submission, briefing a sustainability committee, or launching a public impact dashboard, this kit helps ensure your message lands—not as noise, but as evidence.
When stakeholders remember your report not for its length, but for its clarity—that’s when data stops being background noise and becomes your most persuasive asset.